---
title: 'Between: 2023/06/01 en 2023/06/30 - 0110.be'
canonical: https://0110.be/date/2023/6
markdown_url: https://0110.be/date/2023/6.md
page: 0
posts_per_page: 30
total_posts: 2
filters:
year: 2023
month: 6
previous:
next:
---
# Between: 2023/06/01 en 2023/06/30 - 0110.be
## [Identifying memory leaks in C](https://0110.be/posts/Identifying_memory_leaks_in_C.md)
- Published: 2023-06-29T00:00:00Z
- Updated: 2025-11-29T14:15:58Z
- Author: Joren
- ID: 517
- Canonical: https://0110.be/posts/Identifying_memory_leaks_in_C
- Tags: [Code](https://0110.be/tags/Code.md), [Command Line Application](https://0110.be/tags/Command%20Line%20Application.md), [UGent](https://0110.be/tags/UGent.md)

Fig: Memory leaks.
The C programming language is deceptively simple. The syntax is straightforward, C has a limited amount of keywords and a small standard library. The first edition of the classic book 'The C Programming Language' is only about 200 pages. And yet, when programming in C, it is hard to avoid the many exiting footguns: integer type conversions, unchecked indexes and memory leaks can all cause subtle problems. This is part of the appeal of C: shooting yourself in the foot does make you feel alive. Here I want to focus on ways to check for memory leaks for C programs.
Memory leaks come about when memory is claimed but is never released again. If this is done in a loop or during a long running program, the claimed memory adds up and eventually the system may run out of memory. A memory leak is less a problem if a program forgets to free a small amount of memory it only claims once: after program shut down, the operating system reclaims all memory anyhow. However, it does feels very dirty to not clean up after oneself. And I for one, am not a dirty boy.
Another reason to look for memory use and leaks is when you are programming for embedded devices. For these systems memory is very limited: in that world 500kB RAM is considered a massive amount of memory. I have been busy programming a scalable [audio search system called Olaf](https://github.com/JorenSix/Olaf) which targets both traditional computers, embedded systems and browsers (via WebAssembly). It is clear that memory use --- and memory leaks --- need to be kept in check to pull this of.
Now, these memory leaks might not be easy to spot by inspecting the code. There are tools which help to spot memory management problems. One of these is [valgrind](https://valgrind.org/) which is currently not easy to use on Apple system with ARM processors. Luckily there is an alternative which is probably already installed on macOS via the *XCode Command Line Tools* a command line tool aptly called `leaks`. To quote the [apple documentation on leaks](https://developer.apple.com/library/archive/documentation/Performance/Conceptual/ManagingMemory/Articles/FindingLeaks.html), leaks reports:
- the address of the leaked memory
- the size of the leak (in bytes)
- the contents of the leaked buffer
The most straightforward use of `leaks` is to run a program and generate a report after program shutdown. See below to run a memory leak inspection, in this case for the `bin/olaf_c` program which indexes an audio file in a key-value store. For [CI](https://en.wikipedia.org/wiki/Continuous_integration) purposes it is practical to know that `leaks` has an exit status of zero only when no leaks have been found. The exit status can be used in an automated test script to break a build if a leak is detected. The `--quiet` option can be practical in such setting.
```bash
leaks --atExit -- bin/olaf_c store audio.raw audio
```
In the case of Olaf I made a classic mistake: I had called `free()` on hash table but I needed to call the hash table destructor: `hash_table_destroy()` which freed not only the hash table itself but also all memory associated with the hash table entries. After a quick fix the `leaks` command showed no more leaks!
```
leaks Report Version: 4.0, multi-line stacks
Process 35293: 2200395 nodes malloced for 135146 KB
Process 35293: 2200171 leaks for 138371200 total leaked bytes.
STACK OF 1 INSTANCE OF 'ROOT LEAK: ':
5 dyld 0x1a16dbf28 ...
4 olaf_c 0x100db145c main ...
3 olaf_c 0x100db53c8 olaf_...
2 olaf_c 0x100db4400 olaf_...
1 olaf_c 0x100da5788 hash_...
0 libsystem_malloc.dylib 0x1a1874d88 _mall...
2200171 (132M) ROOT LEAK: [64]
2200170 (132M) [50348032]
2 (80 bytes) [32]
1 (48 bytes) [48]
```
Output of the `leaks` command which shows where a memory leak can be found.
## General takaways
- `leaks` is an easy to use memory leak inspector provided by Apple. It is an alternative for valgrind.
- Memory leaks can be checked automatically using the `leaks` exit status in a CI-script. This makes spotting leaks timely and more straightforward to fix.
- Programmers should at least once try to target embedded devices. It makes you conscious of the wealth of resources available when targeting modern computing devices.



---
## [Optimizing C code with profiling, algorithmic optimizations and 'ChatGPT SIMD'](https://0110.be/posts/Optimizing_C_code_with_profiling%2C_algorithmic_optimizations_and_%27ChatGPT_SIMD%27.md)
- Published: 2023-06-26T00:00:00Z
- Updated: 2025-11-29T14:17:26Z
- Author: Joren
- ID: 518
- Canonical: https://0110.be/posts/Optimizing_C_code_with_profiling%2C_algorithmic_optimizations_and_%27ChatGPT_SIMD%27
- Tags: [Code](https://0110.be/tags/Code.md), [Command Line Application](https://0110.be/tags/Command%20Line%20Application.md), [Music Information Retrieval](https://0110.be/tags/Music%20Information%20Retrieval.md), [UGent](https://0110.be/tags/UGent.md)
This post details how I went about optimizing a C application. This is about an audio search system called [Olaf](https://github.com/JorenSix/Olaf) which was made about **10 times faster** but contains some generally applicable steps for optimizing C code or even other systems. Note that it is not the aim to provide a detailed how-to: I want to provide the reader with a more high-level understanding and enough keywords to find a good how-to for the specific tool you might want to use. I see a few general optimization steps:
-
The zeroth step of optimization is to properly **question the need** and balance the potential performance gains against added code complexity and maintainability.
-
Once ensured of the need, the first step is to **measure the systems performance**. Every optimization needs to be measured and compared with the original state, having automazation helps.
-
Thirdly, the second step is to **find performance bottle necks**, which should give you an idea where optimizations make sense.
-
The third step is to **implement and apply** an optimization and measuring its effect.
-
Lastly, **repeat** steps zero to three until optimization targets are reached.
More specifically, for the [Olaf audio search system](https://github.com/JorenSix/Olaf) there is a need for optimization. Olaf indexes and searches through years of audio so a small speedup in indexing really adds up. So going for the next item on the list above: measure the performance. Olaf by default reports how quickly audio is indexed. It is expressed in the audio duration it can process in a single second: so if it reports `156 times realtime`, it means that 156 seconds of audio can be indexed in a second.
The next step is to find performance bottlenecks. A profiler is a piece of software to find such bottle necks. There are many options [gprof](https://en.wikipedia.org/wiki/Gprof) is a command line solution which is generally available. I am developing on macOS and have XCode available which includes the "Instruments - Time Profiler". Whichever tool used, the result of a profiling session should yield the time it takes to run each functions. For Olaf it is very clear which function needs optimization:
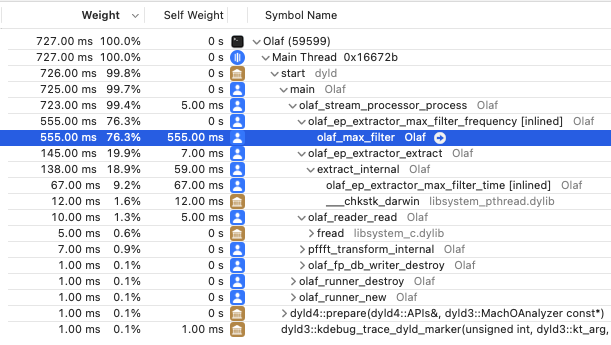 \
Fig: The results of profiling Olaf in XCode's time profiler. Almost all time is spend in a single function which is the prime target for optimization.
The function is a *max filter* which is ran many, many times. The implementation is using a naive approach to max filtering. There are more efficient algorithms available. In this case looking into the literature and implementing a more efficient algorithm makes sense. A very practical [paper by Lemire](https://arxiv.org/pdf/cs/0610046.pdf) lists several contenders and the 'van Herk' algorithm hits the sweet spot between being easy to implement and needing only a tiny extra amount of memory. The Lemire paper even comes with [example c max-filters](https://github.com/lemire/runningmaxmin). With only a slight change, [the code fits in Olaf](https://github.com/JorenSix/Olaf/blob/master/src/olaf_max_filter_perceptual_van_herk.c).
After implementing the change two checks need to be done: is the implementation correct and is it faster. Olaf comes with a number of functional and unit checks which provide some assurance of correctness and a built in performance indicator. Olaf improved from processing audio 156 times realtime to 583 times: a couple of times faster.
After running the profiler again, another method came up as the slowest:
````c
//Naive implementation
float olaf_ep_extractor_max_filter_time(float *array, size_t array_size) {
float max = -10000000;
for (size_t i = 0; i < array_size; i++) {
if (array[i] > max) max = array[i];
}
return max;
}
````
src: naive implementation of finding the max value of an array.
This is another part of the 2D max filter used in Olaf. Unfortunately here it is not easy to improve the algorithmic complexity: to find the maximum in a list, each value needs to be checked. It is however a good contender for [SIMD](https://en.wikipedia.org/wiki/Single_instruction,_multiple_data) optimization. With SIMD multiple data elements are processed in a single CPU instruction. With 32bit floats it can be possible to process 4 floats in a single step, potentially leading to a 4x speed increase - without including overhead by data loading.
Olaf targets microcontrollers which run an ARM instruction set. The SIMD version that makes most sense is the ARM Neon set of instructions. Apple Sillicon also provides support for ARM Neon which is a nice bonus. I asked ChatGPT to provide a ARM Neon improved version and it came up with the code below. Note that these type of simple functions are ideal for ChatGPT to generate since it is easily testable and there must be many similar functions in the ChatGPT training set. Also there are less ethical issues with 'trivial' functions: more involved code has a higher risk of plagiarization and improper attribution. The new average audio indexing speed is 832 times realtime.
````c
#if defined(__ARM_NEON)
#include
// ARM NEON implementation
float olaf_ep_extractor_max_filter_time(float *array, size_t array_size) {
assert(array_size % 4 == 0);
float32x4_t vec_max = vld1q_f32(array);
for (size_t j = 4; j < array_size; j += 4) {
float32x4_t vec = vld1q_f32(array + j);
vec_max = vmaxq_f32(vec_max, vec);
}
float32x2_t max_val = vpmax_f32(vget_low_f32(vec_max), vget_high_f32(vec_max));
max_val = vpmax_f32(max_val, max_val);
return vget_lane_f32(max_val, 0);
}
#else
//Naive implementation
#endif
````
src: a ARM Neon SIMD implementation of a function finding the max value of an array, generated by ChatGPT, licence unknown, informed consent unclear, correct attribution impossible.
Next, I asked ChatGPT for an SSE SIMD version targeting the x86 processors but this resulted in noticable *slowdown*. This might be related to the time it takes to load small vectors in SIMD registers. I did not pursue the SIMD SSE optimization since it is less relevant to Olaf and the first performance optimization was the most significant.
Finally, I went over the code again to see whether it would be possible exit a loop and simply skip calling `olaf_ep_extractor_max_filter_time` in most cases. I found a **condition which prevents most of the calls** without affecting the total results. This proved to be the most significant speedup: almost doubling the speed from about 800 times realtime to around 1500 times realtime. This is actually what I should have done before resorting to SIMD.
In the end Olaf was made about **ten times faster** with only two local, testable, targeted optimizations.
\
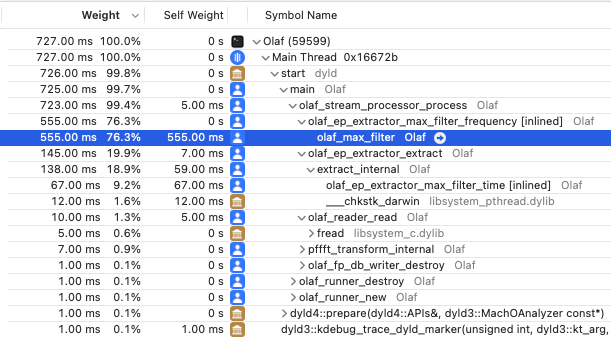
Fig: The results of profiling Olaf in XCode's time profiler. Almost all time is spend in a single function which is the prime target for optimization.
The function is a *max filter* which is ran many, many times. The implementation is using a naive approach to max filtering. There are more efficient algorithms available. In this case looking into the literature and implementing a more efficient algorithm makes sense. A very practical [paper by Lemire](https://arxiv.org/pdf/cs/0610046.pdf) lists several contenders and the 'van Herk' algorithm hits the sweet spot between being easy to implement and needing only a tiny extra amount of memory. The Lemire paper even comes with [example c max-filters](https://github.com/lemire/runningmaxmin). With only a slight change, [the code fits in Olaf](https://github.com/JorenSix/Olaf/blob/master/src/olaf_max_filter_perceptual_van_herk.c).
After implementing the change two checks need to be done: is the implementation correct and is it faster. Olaf comes with a number of functional and unit checks which provide some assurance of correctness and a built in performance indicator. Olaf improved from processing audio 156 times realtime to 583 times: a couple of times faster.
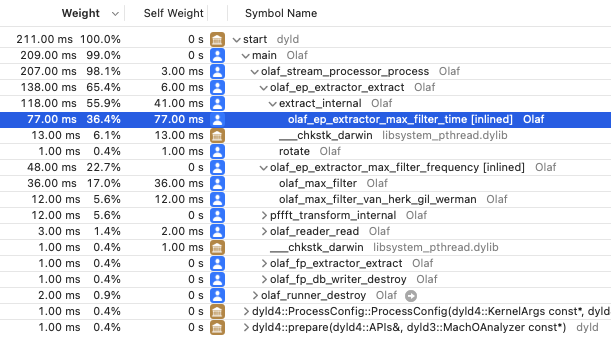
After running the profiler again, another method came up as the slowest:
````c
//Naive implementation
float olaf_ep_extractor_max_filter_time(float *array, size_t array_size) {
float max = -10000000;
for (size_t i = 0; i < array_size; i++) {
if (array[i] > max) max = array[i];
}
return max;
}
````
src: naive implementation of finding the max value of an array.
This is another part of the 2D max filter used in Olaf. Unfortunately here it is not easy to improve the algorithmic complexity: to find the maximum in a list, each value needs to be checked. It is however a good contender for [SIMD](https://en.wikipedia.org/wiki/Single_instruction,_multiple_data) optimization. With SIMD multiple data elements are processed in a single CPU instruction. With 32bit floats it can be possible to process 4 floats in a single step, potentially leading to a 4x speed increase - without including overhead by data loading.
Olaf targets microcontrollers which run an ARM instruction set. The SIMD version that makes most sense is the ARM Neon set of instructions. Apple Sillicon also provides support for ARM Neon which is a nice bonus. I asked ChatGPT to provide a ARM Neon improved version and it came up with the code below. Note that these type of simple functions are ideal for ChatGPT to generate since it is easily testable and there must be many similar functions in the ChatGPT training set. Also there are less ethical issues with 'trivial' functions: more involved code has a higher risk of plagiarization and improper attribution. The new average audio indexing speed is 832 times realtime.
````c
#if defined(__ARM_NEON)
#include
// ARM NEON implementation
float olaf_ep_extractor_max_filter_time(float *array, size_t array_size) {
assert(array_size % 4 == 0);
float32x4_t vec_max = vld1q_f32(array);
for (size_t j = 4; j < array_size; j += 4) {
float32x4_t vec = vld1q_f32(array + j);
vec_max = vmaxq_f32(vec_max, vec);
}
float32x2_t max_val = vpmax_f32(vget_low_f32(vec_max), vget_high_f32(vec_max));
max_val = vpmax_f32(max_val, max_val);
return vget_lane_f32(max_val, 0);
}
#else
//Naive implementation
#endif
````
src: a ARM Neon SIMD implementation of a function finding the max value of an array, generated by ChatGPT, licence unknown, informed consent unclear, correct attribution impossible.
Next, I asked ChatGPT for an SSE SIMD version targeting the x86 processors but this resulted in noticable *slowdown*. This might be related to the time it takes to load small vectors in SIMD registers. I did not pursue the SIMD SSE optimization since it is less relevant to Olaf and the first performance optimization was the most significant.
Finally, I went over the code again to see whether it would be possible exit a loop and simply skip calling `olaf_ep_extractor_max_filter_time` in most cases. I found a **condition which prevents most of the calls** without affecting the total results. This proved to be the most significant speedup: almost doubling the speed from about 800 times realtime to around 1500 times realtime. This is actually what I should have done before resorting to SIMD.
In the end Olaf was made about **ten times faster** with only two local, testable, targeted optimizations.
## General takeways
- Only think about optimization **if there is a need** and set a target: otherwise it is infinite.
- Try to **find a balance** between complexity, maintainability and performance.
- Changing **a naive algorithm to a more intelligent one** can have a significant performance increase. Check the literature for inspiration.
- Check for conditions to skip hot code paths **before trying fancy optimization** techniques.
- **Profilers** are crucial to identify where to optimize your code. Applying optimizations blindly is a waste of time.
- Try to keep optimizations **local and testable**. Sprinkling your code with small, hard to test performance oriented improvements might not be worthwile.
- **SIMD generated by ChatGPT** can be a very quick way to optimize critical, hot code paths. I would advise to only let ChatGPT generate small, common, easily testable code: e.g. finding the maximum in an array.
- Having only localized 'trivial' ChatGPT parts means you can **take them out** once it is clear that [you have copied code without proper attribution or licensing](https://www.reuters.com/technology/google-one-ais-biggest-backers-warns-own-staff-about-chatbots-2023-06-15/).
- The **use of SIMD can slow down** your code if you are not careful, measure the effects of your 'optimizations'!
---