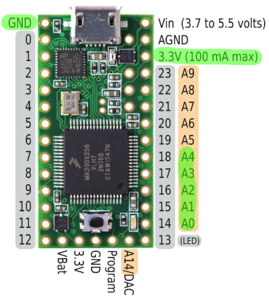
Fig 1. Ports used from the Teensy
TeensyDAQ is a Java application to quickly visualize and record analog signals with a Teensy micro-controller and some custom software. It is mainly useful to quickly get an idea of how an analog sensor reacts to different stimuli. Since it is also able to capture and store analog input siginals it is also useful to generate test data recordings which then can be used for example to test a peak detection algorithm on. The name TeensyDAQ hints at the Data AcQuisition features and the micro-controller used.
Some of the features of the TeensyDAQ:
The system consists of two parts. A hardware and a software part. The hardware is a Teensy micro-controller running an Arduino sketch that ready analog input A0 to A4 at the requested sampling rate. A Teensy is used instead of a regular Arduino for two reasons. First the Teensy is capable of much higher data throughput, it is able to send five reading at 8000Hz, which is impossible on Arduino. The second reason is the 13bit analog read resolution. Classic Arduino only provides 10 bits.
Fig 1. Ports used from the Teensy
The software part reads data from the serial port the Teensy is attached to. It interprets the data and stores it in an efficient data-structure. As quickly as possible the data is visualized. The software is written in Java. A recent Java runtime environment is needed to execute it.
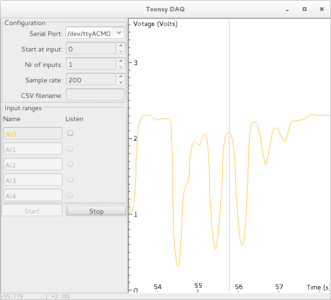
Fig 2. Screenshot of TeensyDAQ running with live input.
First get a Teensy micro-controller and flash it with the sketch in sketches/TeensyAnalogRead with TeensyDuino. It needs the IntervalTimer library. Once you have flashed your Teensy, attach an analog sensor to board. A simple example is e.g. a ligth sensor:
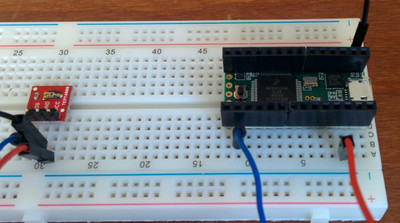
Fig 1. Light sensor attached to a Teensy
Once you have your sketch running, head over to the TeensyDAQ release repository and download the latest TeensyDAQ application. If the JRE is installed correctly you should be able to simply double click it. Otherwise execute java -jar TeensyDAQ-latest.jar on the command line. Once you see the interface press start to get a live view of the incoming analog signals. Press f while hovering the mouse over the graph to stop following the data-stream, subsequently you are able to pan, zoom and select parts of the signal.
To save a stream of data simply type in a filename in the CSV filname text field and press start. It will create a file in the same directory as the jar file. To visualize the contents of a previously created CSV-file, simply drag and drop the CSV-file to the graph. The contents should show up immediately.
Every release of TeensyDAQ contains the following:
TeensyDAQ-x.x-Documentation/ JavaDoc documentationTeensyDAQ-x.x-Readme.html This readme.TeensyDAQ-x.x.jar the executable JAR file with source files included.If you want to build from source, or want to improve TeensyDAQ follow the instructions below. Contributions to TeensyDAQ are more than welcome, if you have a feature to add or find a bug, do not hesitate to send me a message.
TeensyDAQ uses Apache Ant as a build system. The instructions below detail how you can build from source.
Next to Apache Ant you also need git installed on your system. The following commands fetch the source and build the library and example jars:
git clone https://JorenSix@github.com/JorenSix/TeensyDAQ.git
cd TeensyDAQ
cd build
ant
ant javadoc #Creates the documentation
The source tree is contains these folder:
src contains the source files of the library.lib contains the required dependencies libraries.sketches contains sketches for the Teensy microcontroller. They are compatible with TeensyDuinobuild contains the ant build file.TeensyDAQ is programmed by Joren Six and is supported by University Ghent, IPEM.
First release which includes basic functionality.
Update to support automatic naming of data files and sample rate choice.